
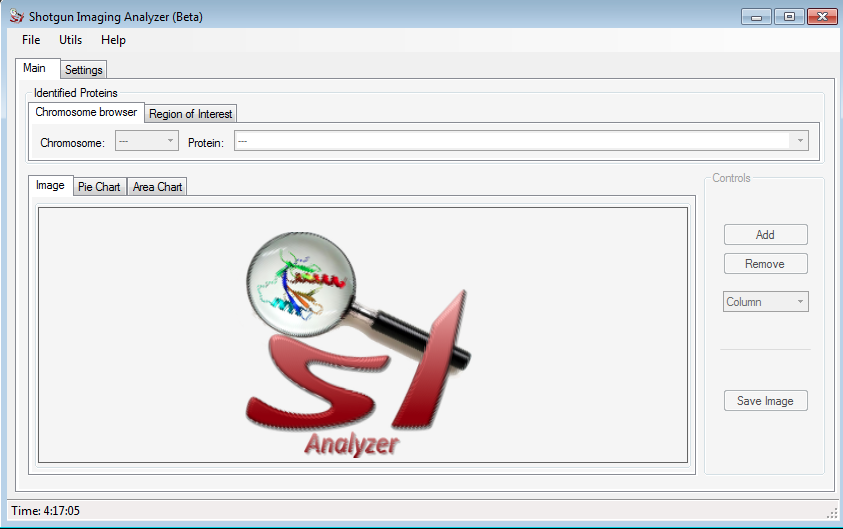
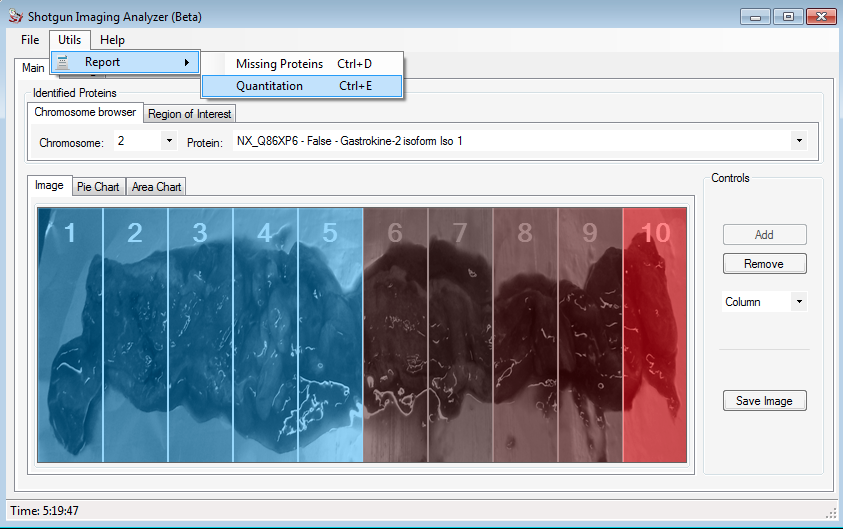
Shotgun Imaging Analyzer - SIA is a shotgun imaging software to allow visual assessment of the proteomic profiles along biopsies or surfaces. SIA was tailored to take advantage of the NeXtProt and therefore fits well into the context of the C-HPP Project. A pull-down menu enables browsing identified proteins according to a chromosome of interest. By selecting it, only proteins identified in the experiment at hand for that respective chromosome will be listed in the right pull-down menu. By selecting a protein, the graphical user interface (GUI) will overlay a heat map using grayscale to indicate regions where the protein was not identified and different tones of red to indicate its relative abundance.
SIA is user-friendly, simple and provides a graphical user interface.
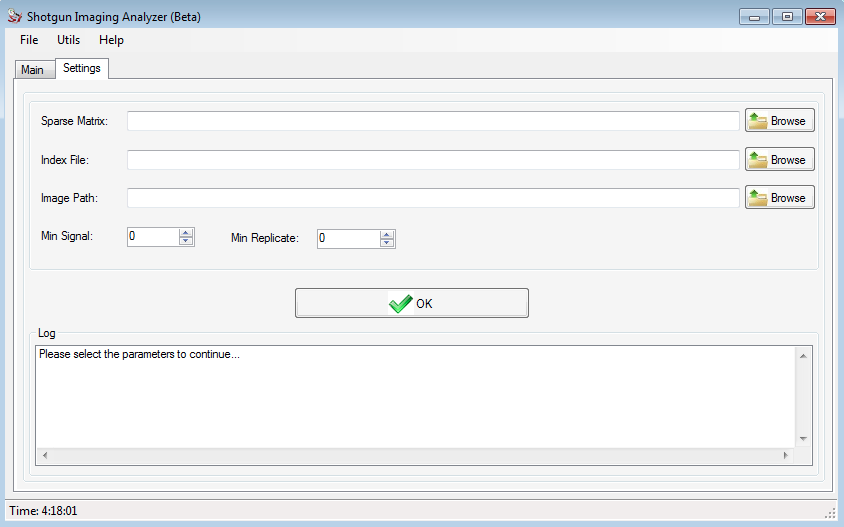
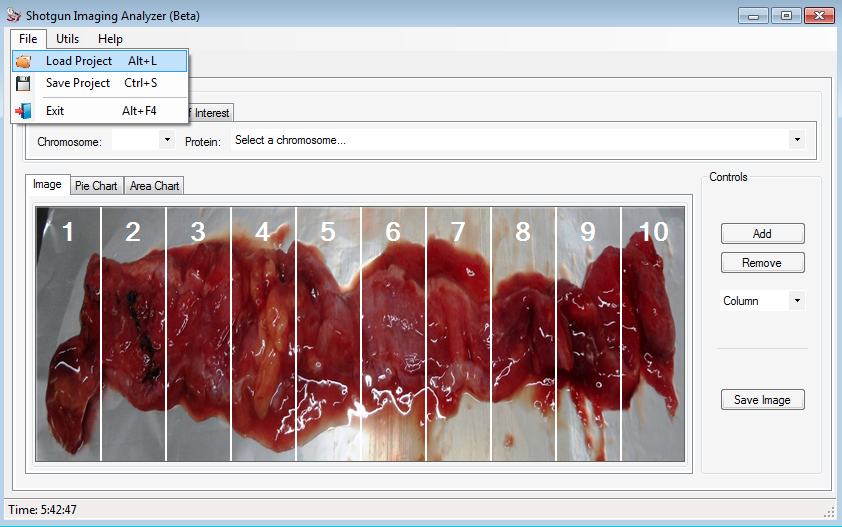
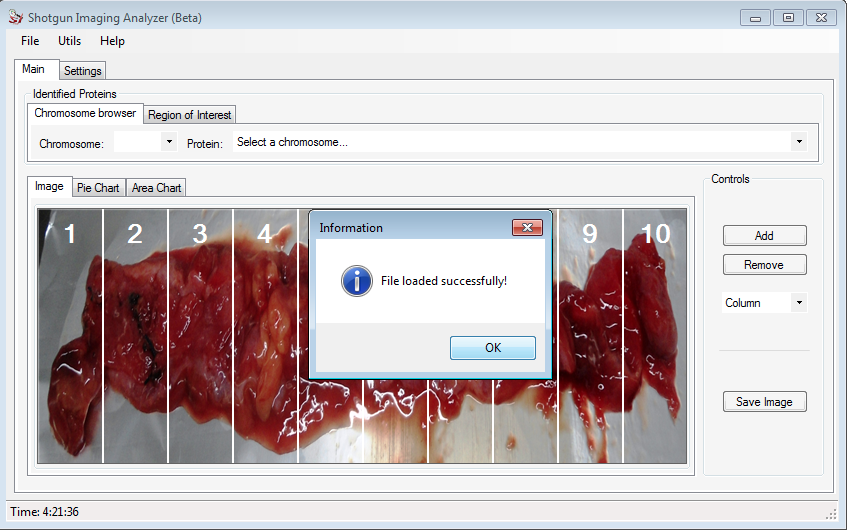
After install SIA, the user can create a new project following a few steps.
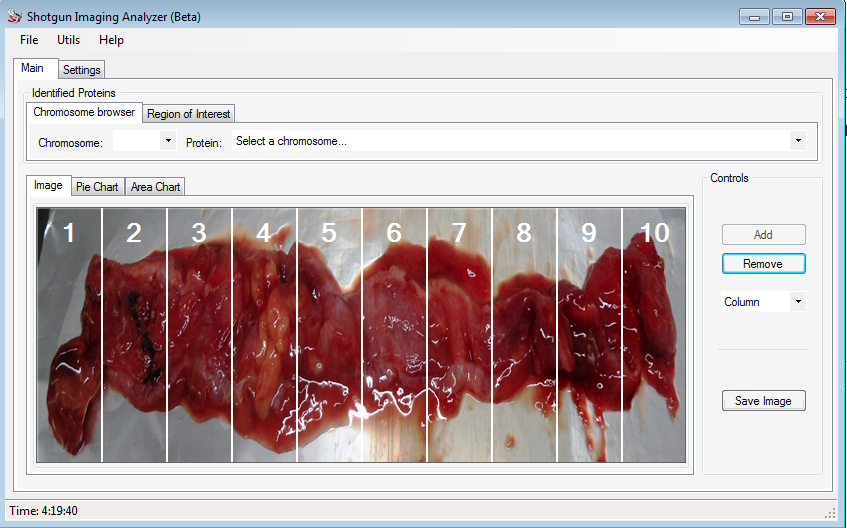
In the Control field, the user can add / remove the columns and/or rows to divide the image according to what he wants.
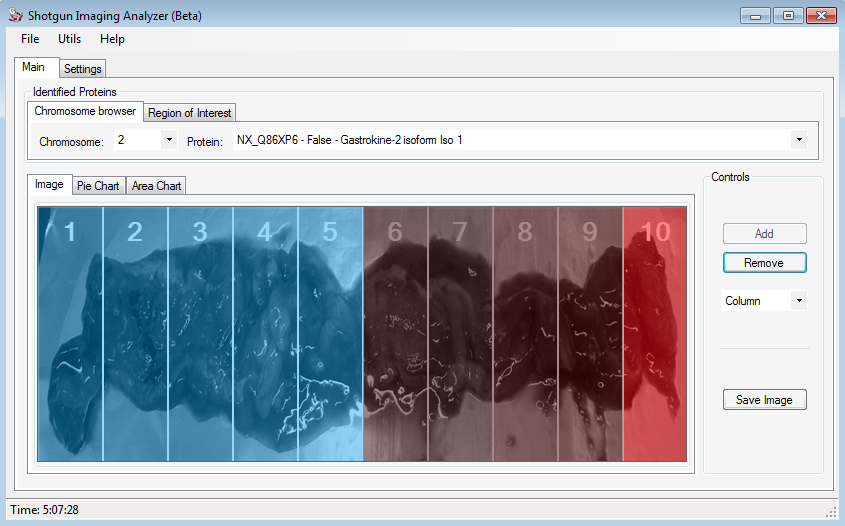
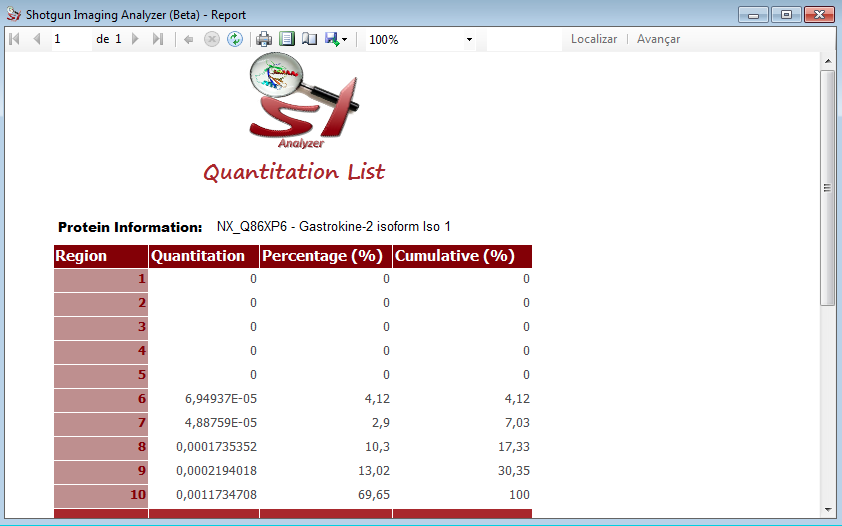
The figure above shows the example of the Gastrokine 2 protein, that was analyzed for us. The user can save this image, simply clicking on Save Image button.
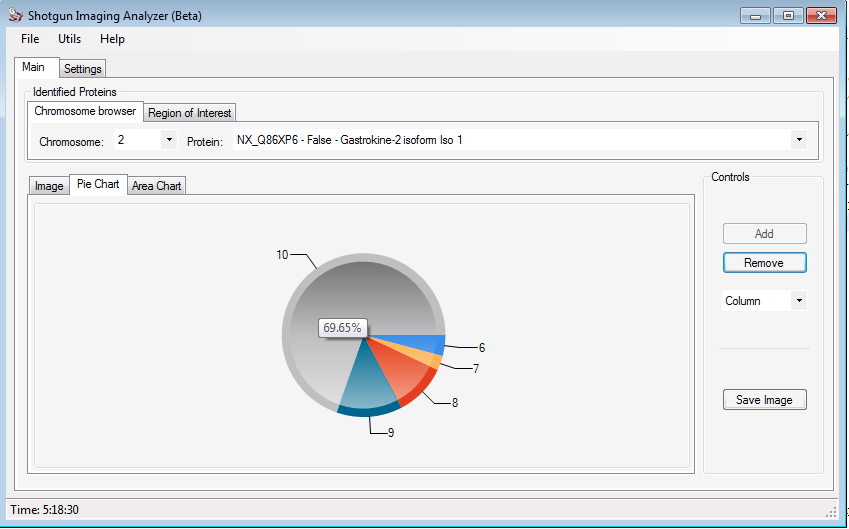
Clicking on the Pie Chart tab, the user can visualize a graphic with the protein intensity in each slice of the image. Moving the mouse over the picture, the percentage of the respective portion is showed.
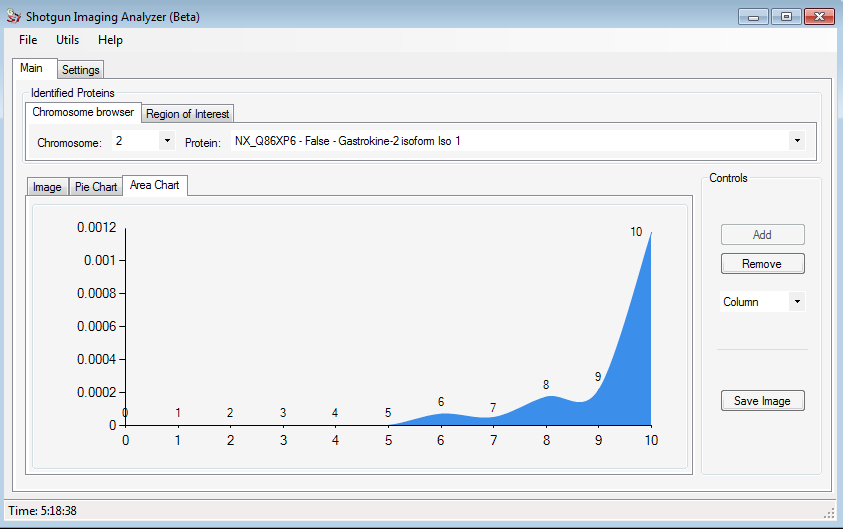
In the Area Chart is showed a graphic with the distribution of the same protein intensity. The figures below shows the respective graphics.
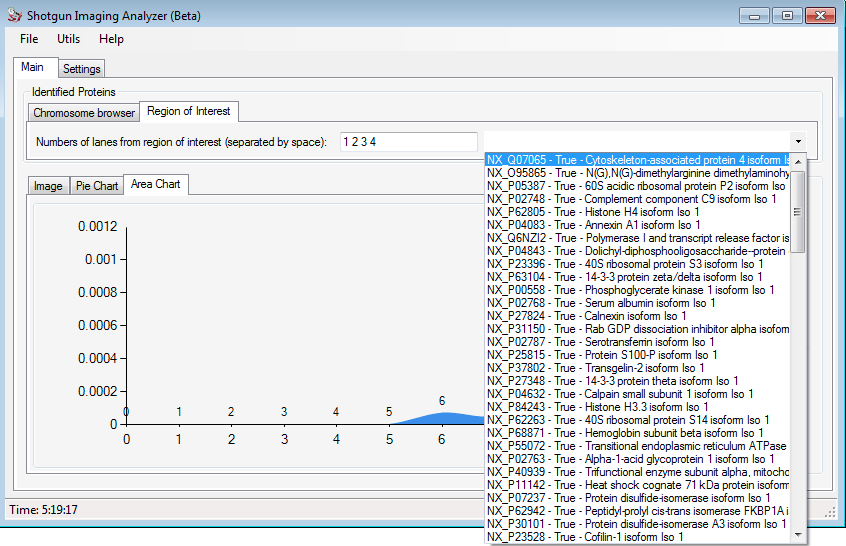
Clicking on the Region of Interest (ROI) the user can indicate what are the lanes of interest to him and automatically SIA will search for proteins that present the higher expression in the ROI. The figure below shows a example for it.
Any doubts, please contact us.
A computer capable of running Windows Vista, Windows 7 or Windows 8.
A computer with a minimum of 2 GB RAM is recommended.
A computer with a minimum of 40 MB available in Hard Disk (HD) is recommended.
Windows Vista, Windows 7 or Windows 8.
The .NET Framework 4.5, SQL Server Express, Microsoft Report Viewer and Windows Installer 4.5, which can be automatically and freely updated by SIA during installation if necessary.
All Rights reserved.
For more information, access Computational Proteomics Brazil